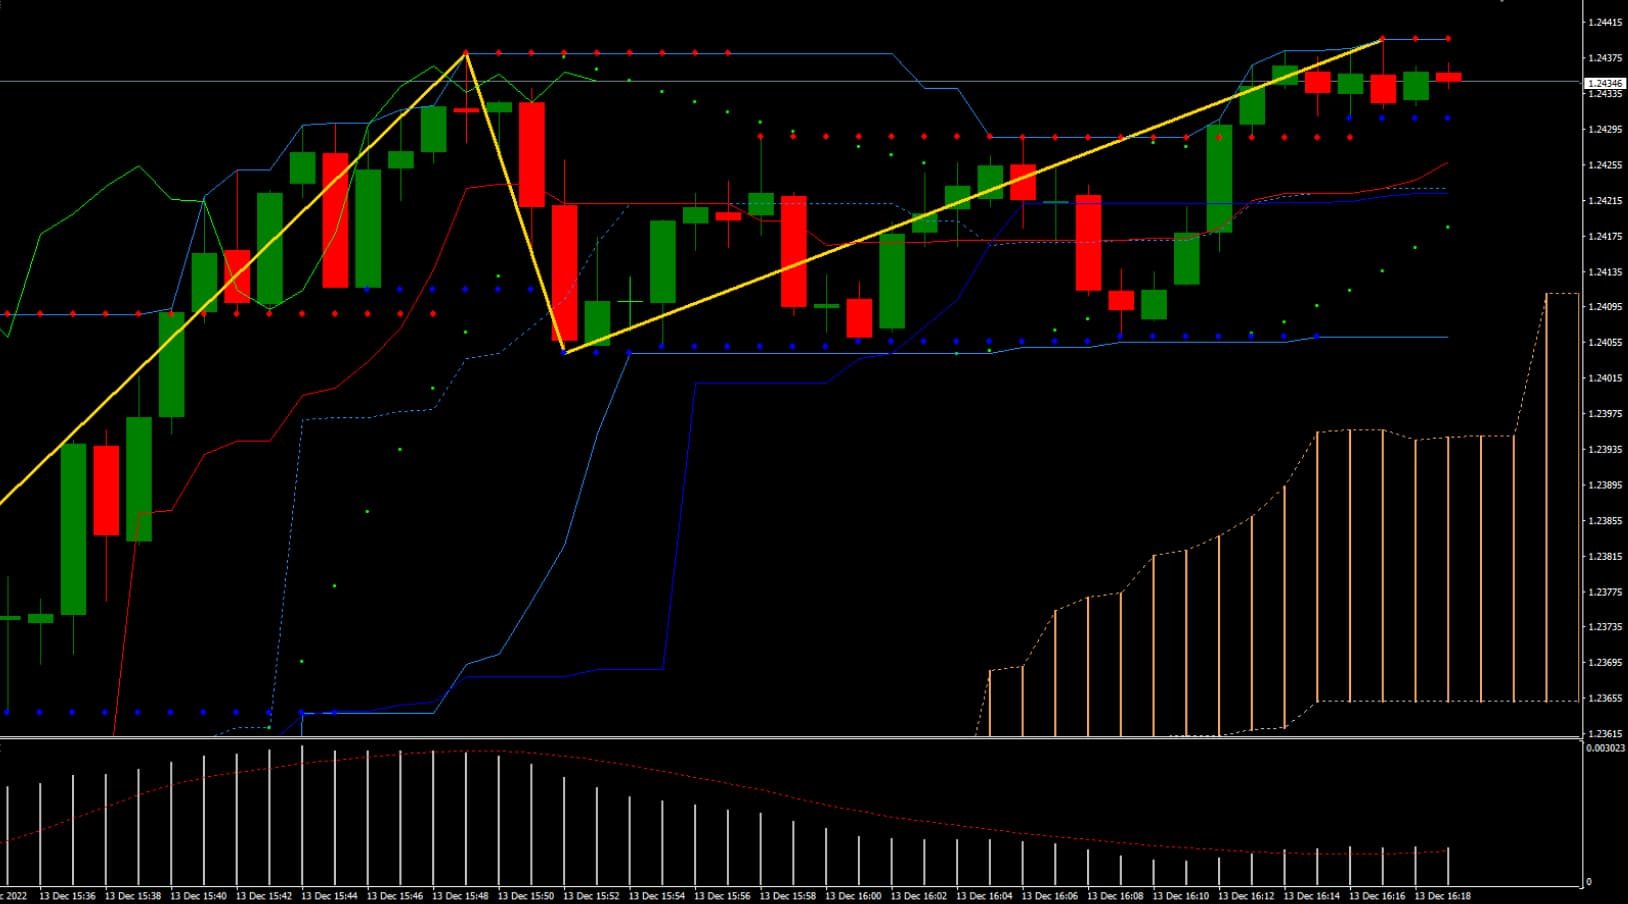
Asset quotes are the most unpredictable element of trading. Intuitive or emotional price forecasting leads almost always to the loss of the deposit. It is composure, understanding the fundamentals of the market and a systematic approach that can minimize risks. Each trader must adhere to a clear trading plan from the very start, for which Forex indicators and technical analysis will be a good help.
Indicators are a trading tool that even an inexperienced trader can use. Classic Forex indicators are developed based on the fundamental work of stock gurus and have been time-tested. In addition to currency pairs, indicators can be used to trade cryptocurrencies, oil, precious metals, stocks, and stock indices.
Why Traders Need Indicators and What They Are
Indicators are the foundation on which the technical analysis of charts is formed, in fact, it is a program that converts the price into other visual forms to predict market movements. The main purpose of indicators is as follows:
- Help with marking charts;
- Formation of signals for opening and closing transactions;
- Presentation of real market trends;
- Displaying the necessary information (spread, lot, commission, time, sessions);
- Formation of a trading strategy;
- Simplification of trade processes;
- Creation of expert advisers trading instead of a trader 24/7;
- Determining the required price characteristics;
- Assistance in identifying patterns and historical coincidences.
Types of Indicators
Depending on the goals, technical indicators are usually divided into the following types:
Trend Indicators
Determining the direction of movement of quotes (trend) is the primary task facing the trader. Trend indicators solve the following problems:
- Determining the global direction of the trend;
- Fixation of changes in the market trend;
- Search for a signal to open a transaction;
- Performing as a signaling tool in a trading strategy.
Basically, a trend indicator is an averaging of charts of various types and forms, and sometimes even mathematical formulas.
Oscillators
The oscillator shows the current market situation. Mostly, this is either the trading asset is overbought or oversold. In fact, the oscillator indicates the situation where the market trend is reaching its peak and the probability of a reversal or correction is most likely.
There is no trend as such for oscillators. They generate a large number of signals and thus compare the current state of affairs in the market with the immediate past. Because of this, when a trend is long and highs or lows are regularly updated, oscillators can send a lot of false signals. In this case, it does not matter which oscillator is used, they all operate on the same principle and there will still be false signals. For this reason, the use of an oscillator can only be effective in conjunction with other indicators.
Volume Indicators
The price movement occurs when someone buys or sells an asset, so studying trading volumes helps understand who started the price movement: major players or a small group of active traders (usually speculators).
Forex is an OTC market. The absence of a single control center makes it impossible to determine the real amounts of money circulating on the market. It is clear that a lot depends on the major players, and it is for an approximate measurement of their activity that volume indicators were invented.
These indicators are rarely used as a tool for finding an entry point, and if there is an imbalance in one direction, you can decide on a short-term strategy.
Predictive Indicators
A novice trader is usually not familiar with the market and its rules, so it is tempting to get an accurate, professional forecast and start making a profit right away. Indicators that draw “accurate forecasts” and indicate where quotes will be in the short or long term are designed for such traders. However, these indicators also include those that are looking for historical coincidences and, based on them, are trying to predict the future movement of the market. It works out sometimes.
Assistants
This is a very useful group of indicators. They do not give any advice, but they help the trader to quickly resolve current issues that arise during trading. To understand, here are some of the functions of assistants. These are:
- Markup of support and resistance levels;
- Displaying of secondary information on the account;
- Building graphic shapes;
- Identifying candlestick models and patterns;
- Visualization of trading session boundaries.
This is not a complete list, but each of the assistants makes the picture of the market clearer. These indicators are the best option to start with for novice traders.
Using Indicators: Pros and Cons
Both beginners and experienced traders use indicators; it is difficult to analyze the market and make forecasts without them. However, there are downsides. For example, their signals may be delayed. Another disadvantage is the lack of connection with fundamental analysis. Indicators only record the movement of quotes after important news, the release of macroeconomic statistics, etc.
However, the advantages of using indicators are much greater:
- They are easy to use;
- Clear visual form of signals;
- Time saving;
- They are applicable in trading almost any asset on the market;
- Easy configuration of their parameters;
- They become the basis or important assistants in creating trading strategies;
In conclusion, it is important to know that the indicators do not provide a 100% guarantee that the transaction will be successful. Yes, this is indeed an effective tool, and it depends only on the trader how effectively it will be used.


